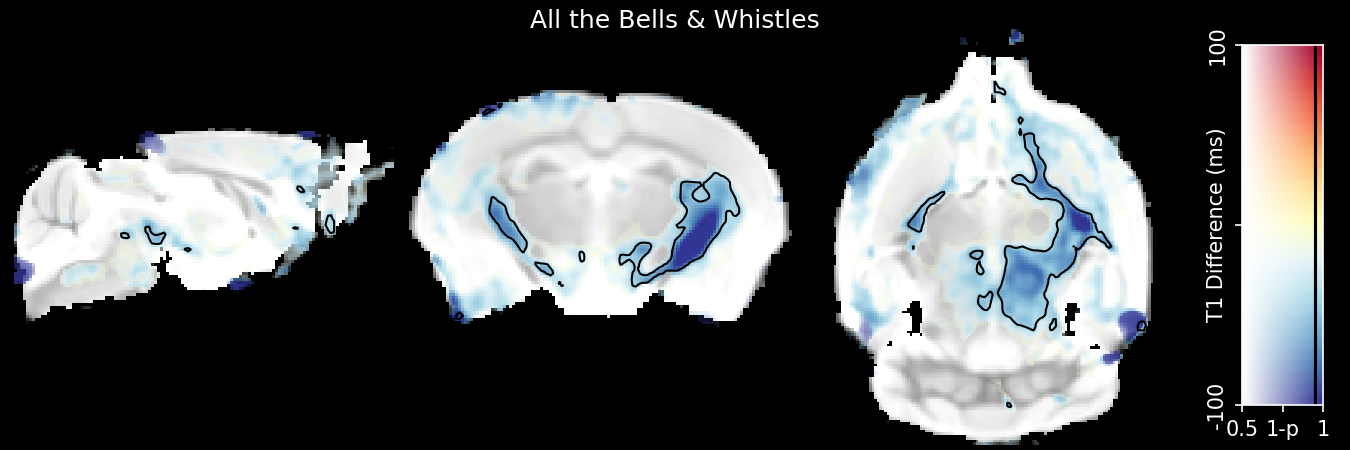
This is a pure Python module for taking slices through MR Images and displaying them in beautiful ways. It is friendly to both clinical and pre-clinical data, and includes dual-coding (http://dx.doi.org/10.1016/j.neuron.2012.05.001) overlays.
This is an example of an image you can make with it:
And here is an example of the viewer application:
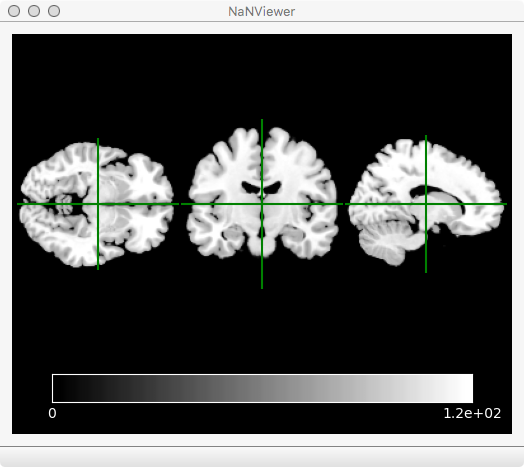
Along with the nanslice module that can be used in your Python scripts, there are
several utitlity functions for use in jupyter notebooks, including a three-plane
viewer. There are also three command line tools that will installed to your $PATH:
nanslicerProduces different kind of slice-plots including color barsnanviewerA three-plane viewer. Requires PyQt.nanvideoConverts time-series images to a movie file for easy viewing.
Why does nanslice exist when there are plenty of other great MR viewing tools, e.g.
[FSLEyes](https://fsl.fmrib.ox.ac.uk/fsl/fslwiki/FSLeyes) or
[MRIcroGL](http://www.cabiatl.com/mricrogl/)? There are three reasons:
- Compatibility with pre-clinical data. Small animals (rodents) are scanned in a different orientation to humans, and hence have different definitions of superior-inferior and posterior-anterior. This makes using such images with clinically focussed tools tedious.
- Support for [dual-coding overlays](https://www.cell.com/neuron/fulltext/S0896-6273(12)00428-X)
- [Inner-Platform Effect](https://en.wikipedia.org/wiki/Inner-platform_effect). Seen as you have to learn scripting languages if you want to have repeatable plots in other tools, you might as well build your plots with a common language straight away.
(Note: I love both MRIcroGL and FSLEyes, I use them all the time)
Okay, there’s a fourth reason. I am fussy about plots. I spend a lot of time on then. Having
immediate access to all of matplotlib is a brilliant way to make beautiful plots (and also
to waste hours obessessing about your choice of fonts. Avenir Next is a hell of a drug).
Contents:
Indices and tables
Legal
Copyright 2018 tobias.wood@kcl.ac.uk
This Source Code Form is subject to the terms of the Mozilla Public License, v. 2.0. If a copy of the MPL was not distributed with this file, You can obtain one at http://mozilla.org/MPL/2.0/.